Monitoring
Spring Boot Actuator
Dependencies
Added to pom.xml these dependencies enable monitoring functionality
spring-boot-starter-actuator
Enables monitoring and provides auto-configuration for Micrometer.micrometer-registry-prometheus
This runtime dependency in the classpath configures Micrometer to expose metrics in a format compatible with Prometheus.micrometer-tracing-bridge-brave
Enables tracing to link logs across different services. There are multiple options, should be easy to switch
Endpoints
- info
- health Shows application health information. used by Kubernetes for health check
- metrics Shows “metrics” information for the current application. configuration in application.yml should be added to the security configuration
Note: In some cases (JVM is out of Metaspace memory) the check indicates the service is healthy even though it's not
management:
  endpoint:
    health:
      enabled: true
      show-details: when-authorized
  endpoints:
    web:
      base-path: /accounting/actuator
      exposure:
        include: health,info,prometheus
See Spring Boot documentation for further information
Metrics categories
Metrics data roughly falls into the following categories:
- application (HTTP Server Request metrics, logback events, mongodb pool sizes)
- JVM
- pods
- nodes
Prometheus
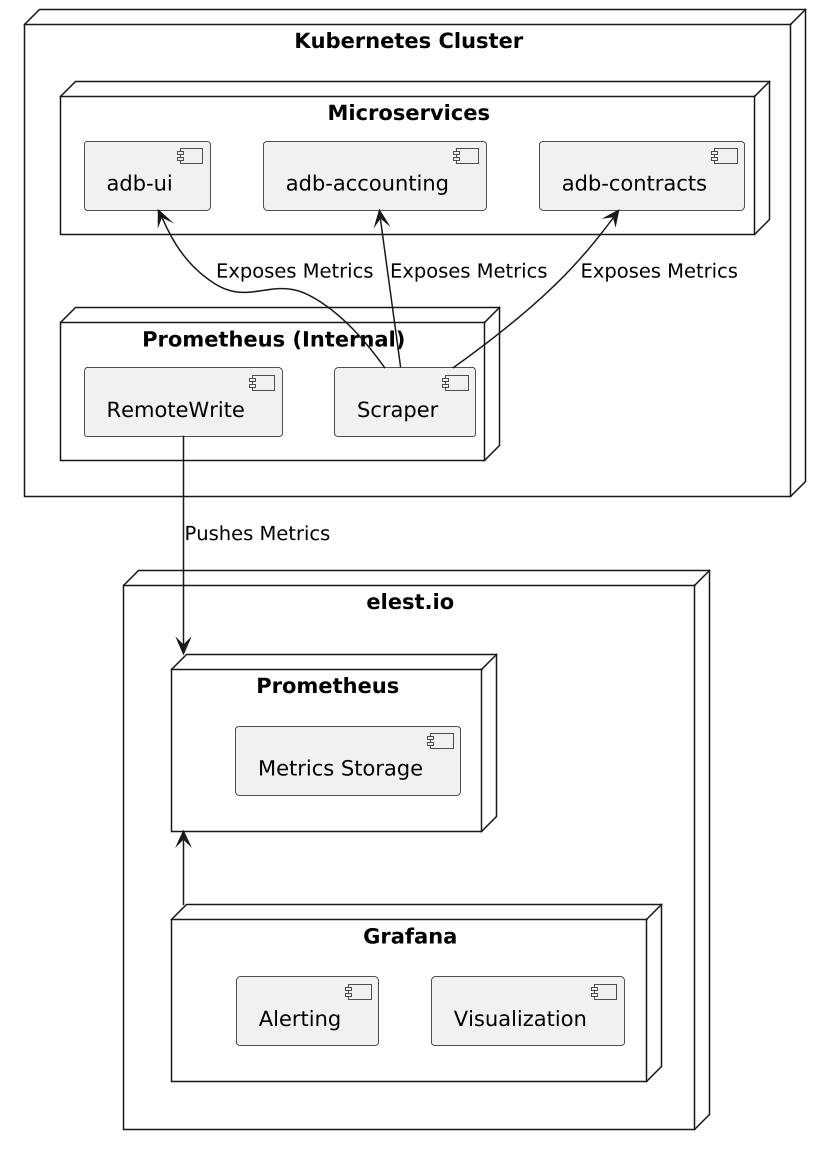
A Prometheus server is deployed within the cluster to scrape metrics from services. It interacts with the Kubernetes API to dynamically adjust its scraping configuration as the number of services or their IPs change. However, a decision was made to avoid storing data in this internal Prometheus instance. Instead, a managed Prometheus server was deployed on the Elest.io platform. To keep the internal Prometheus server private and avoid exposing it outside the Kubernetes cluster, metrics are pushed from it to the external server using remoteWrite.
Grafana
Grafana is used to visualize the scraped metrics from Prometheus. The visualization is structured into dashboards, which consist of multiple panels displaying relevant data. This structure is highly configurable, allowing users to customize dashboards based on their needs. Panels can present time series data that is aggregated and processed using Prometheus Query Language (PromQL), enabling in-depth analysis. Additionally, alerting is configured within Grafana, ensuring that when certain conditions are met, notifications are sent to the appropriate Slack channels for timely response.